
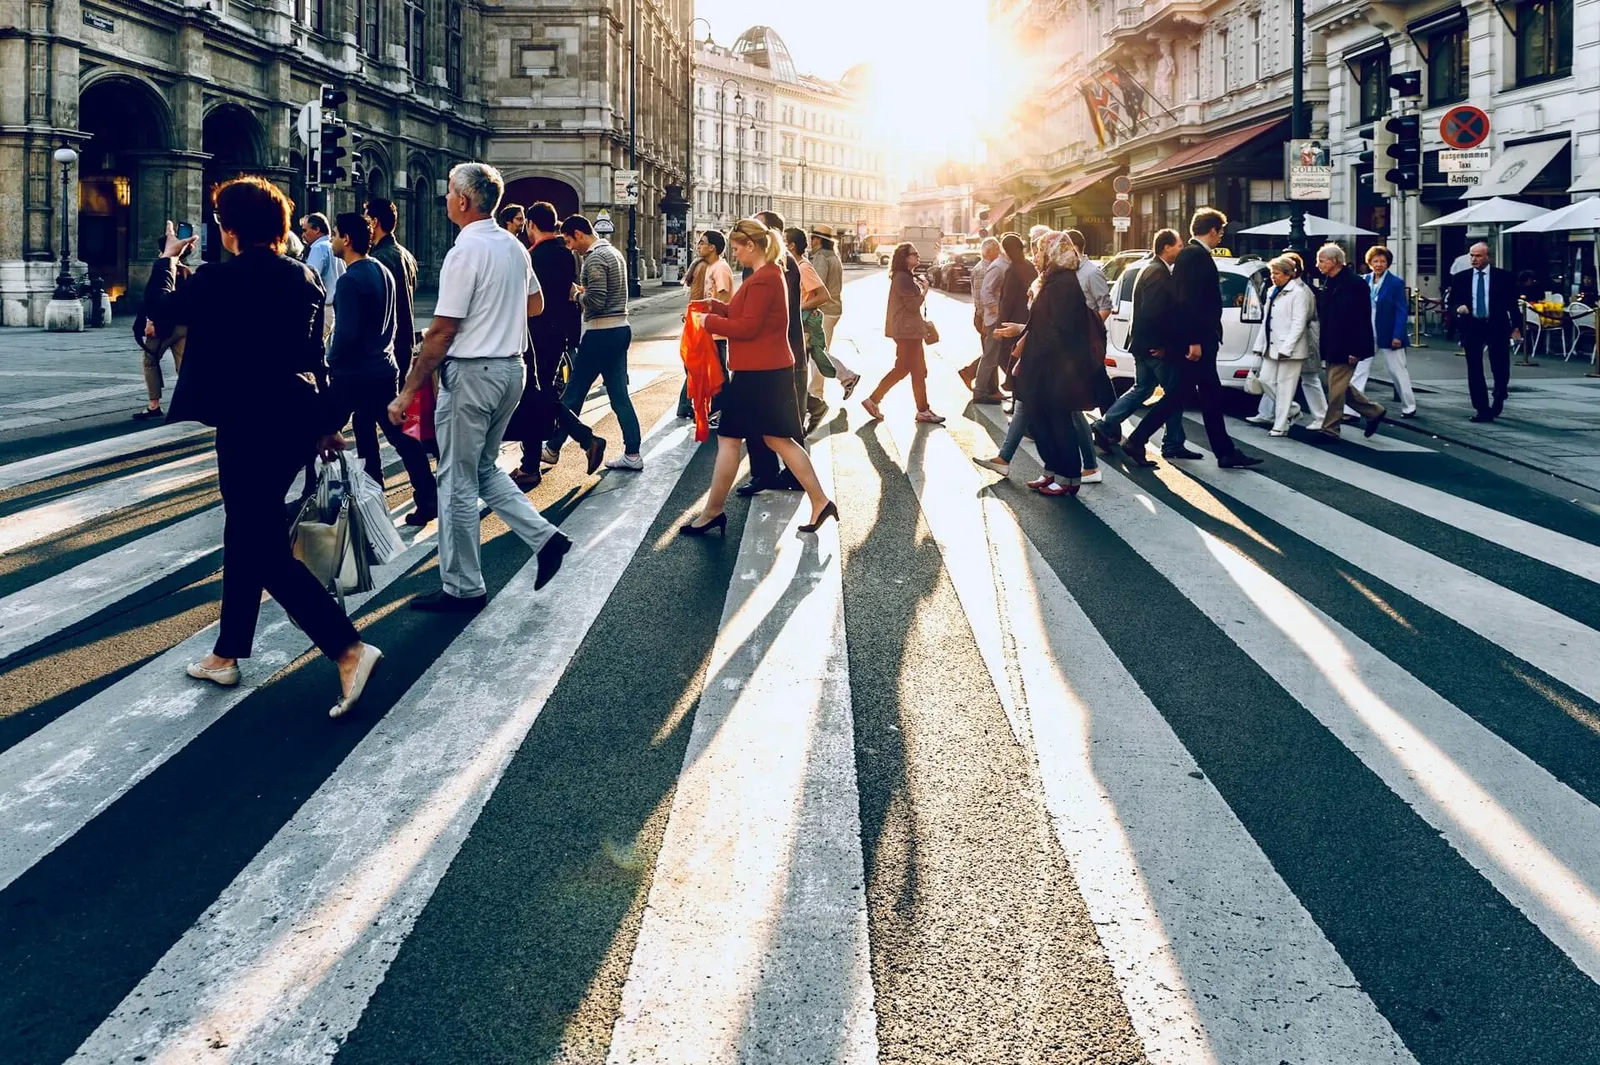
Most adults walk at about 1.4 metres per second, or roughly 5 km/h. That is 12 minutes for a kilometre. A group walks slower than its members do alone, and people over 80 average under 1 metre per second. For a meetup, plan on 1.2 m/s for a mixed group: 14 minutes per kilometre, 7 minutes for 500 metres.
The 1.4 figure comes from a lot of data. In 2011, Richard Bohannon and A. Williams Andrews pooled 41 studies covering 23,111 people in a meta-analysis of normal walking speed. The fastest group, men in their forties, averaged 1.43 m/s. The slowest, women aged 80 to 99, averaged 0.94 m/s. The University of Toronto publishes the age and sex breakdown as a one-page table.
Speed by age
| Age | Men (m/s) | Women (m/s) |
|---|---|---|
| 20–29 | 1.36 | 1.34 |
| 30–59 | 1.43 | 1.31–1.39 |
| 60–69 | 1.34 | 1.24 |
| 70–79 | 1.26 | 1.13 |
| 80–99 | 0.97 | 0.94 |
The numbers barely move between 20 and 60. They start to fall in the sixties and drop sharply after 80. If your group includes a grandparent, their speed sets the pace, not the average.
These were measured on clear, flat walkways in a lab or a corridor. The authors themselves warn that short tests from a standing start, or tests with a turn, give different results. A city street has kerbs, crossings, other people and shop windows. Real walking is slower.
What slows a group down
Traffic engineers use a lower figure than the lab average. The US standard for timing pedestrian crossings assumes 3.5 feet per second, about 1.07 m/s, so that slower walkers can still cross in time. That is a good number to use when the group includes children or older relatives.
Crowds cut speed further. Once a pavement fills up, people can no longer pick their own pace and everyone moves at the speed of the slowest person in front. Leaving a stadium or a concert, walking pace can drop to a shuffle for the first few hundred metres.
Groups are slower than people on their own, too. Friends walking together slow down to stay side by side and keep talking, and video studies of city streets show the effect clearly.
Minutes to the meeting point
Use the column that fits the slowest person in the group.
| Distance | 1.4 m/s (adult alone) | 1.2 m/s (mixed group) | 1.0 m/s (kids, older relatives) | 0.8 m/s (crowd) |
|---|---|---|---|---|
| 200 m | 2 min | 3 min | 3 min | 4 min |
| 500 m | 6 min | 7 min | 8 min | 10 min |
| 1 km | 12 min | 14 min | 17 min | 21 min |
| 2 km | 24 min | 28 min | 33 min | 42 min |
Map apps give walking times based on a fixed speed, usually close to the adult average. For a group of six with a toddler and a pushchair, add a third on top. If the route has stairs, a bridge or a station to cross, add a few minutes more.
A simple rule for planning: count 15 minutes per kilometre for a group, and 20 minutes if the streets will be busy. Then pick the meeting time from that.
Where we use this
When we added stops to OnTime, we chose to show the distance to the stop, not a walking time. A distance is something the app can measure. A time depends on who is walking, how busy the street is and whether someone stops for coffee. With the table above you can turn "800 m to the café" into a time that fits your group.